Discover where your tax euros go with this transparent, interactive visualization tool. Explore government spending and engage in shaping public policy. This post is a part of “pet project” series: projects I would’ve done if I had infinite amount of time or I think are helpful for the people building their CVs. First version is implemented in https://berlin-bill.eamag.me thanks to AI.
Summary
This tool provides a transparent visualization of government spending, allowing you to explore how your tax contributions are allocated across different sectors. By examining a pie chart based on your tax amount, you can delve into spending within specific sectors and engage with decision-makers to actively participate in shaping public policy. This resource aims to raise awareness and promote informed discussions about tax revenue allocation.
Slides
Your $1000:
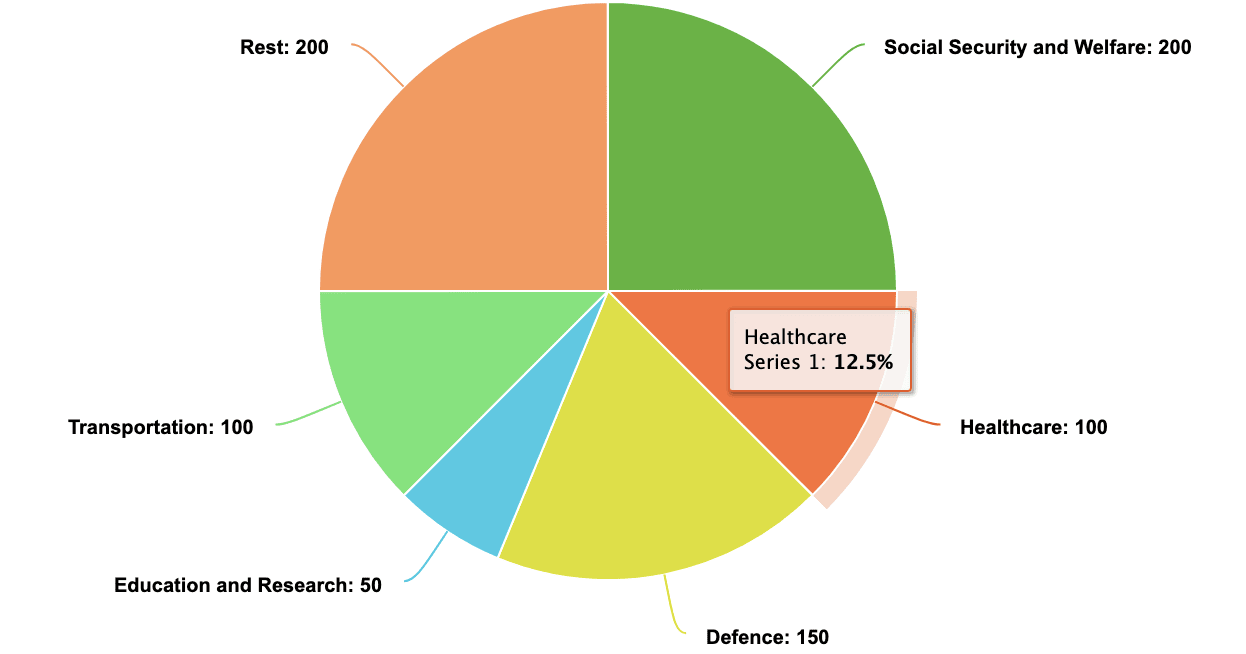
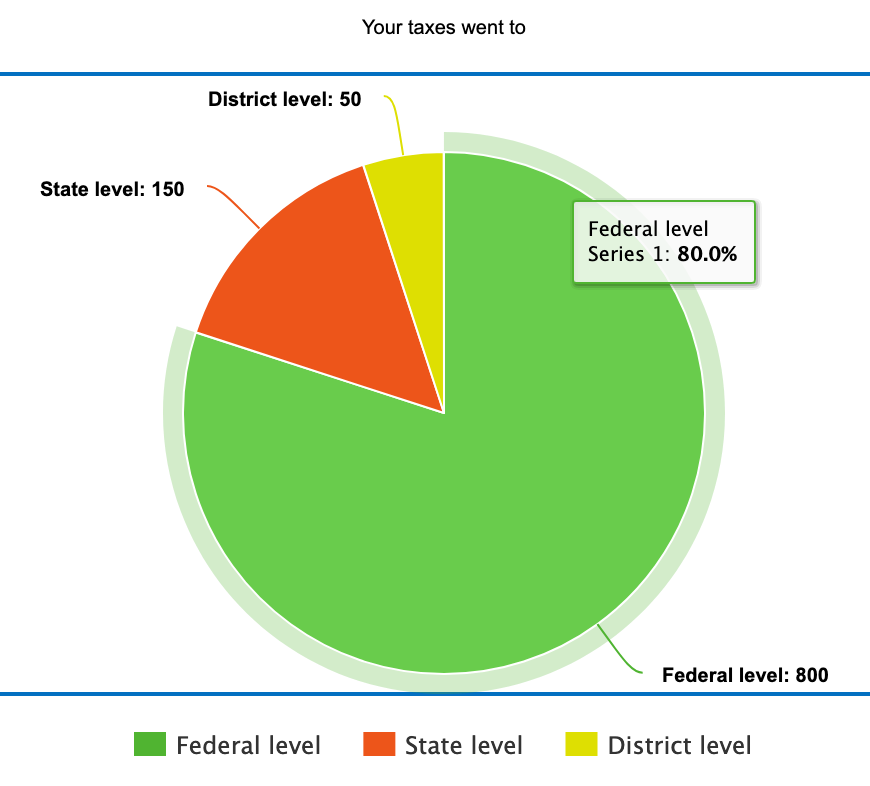 On the Federal level your $800:
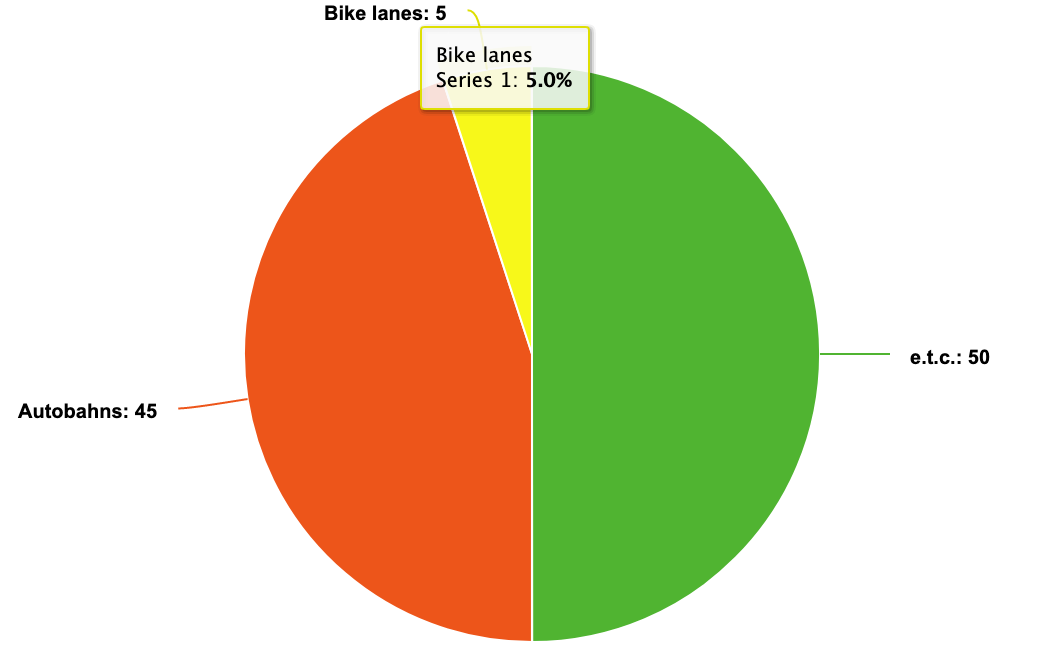
 After clicking on Transportation:
 And you see that Herr Franz made this decision, working at the department of transportation, working hours and email.
Reddit post
Hi Reddit! I’m working on a project called “Where Do Your Tax euros Go?” and I’d appreciate your help. The idea is to create a visualization showing how tax euros are spent by the government. It’s designed to help people understand where their money goes and encourage them to participate in shaping public policy.
The project involves collecting data from government sources, calculating the percentage of tax money spent on each sector, and designing an interactive pie chart based on a user’s tax amount. Users can explore spending within specific sectors and engage with decision-makers using contact information provided by the tool.
I’ve included a couple of examples to show how this tool might be useful for people who want to understand their tax contributions better and advocate for change in their community. If you’re interested in contributing to this project or have any suggestions, please let me know! Currently, I need help navigating government websites and open data sources to gather accurate information for the tool. I’ll be starting with the Finanzplan from bundesfinanzministerium.de and adding data step by step. Thanks!
Project Overview
The objective of this tool is to create a clear visualization that shows how your tax euros are spent by the government, helping you understand where your money goes and encouraging you to participate in shaping public policy. By providing a transparent way to see how your tax euros are spent, the tool allows you to better understand government spending and its impact on public policy. This visualization serves as a valuable resource for raising awareness and promoting informed discussions about tax revenue allocation.
- Data Collection:
a. Gather data from relevant government sources, such as the Office of Management and Budget, on tax revenue allocation and spending across various sectors (e.g., healthcare, defense, education, transportation, etc.).
b. Obtain breakdowns of spending within each sector (e.g., in the Department of Transportation, how much is spent on highways, public transit, bike lanes, etc.).
c. Calculate the percentage of tax money spent on each sector, as well as the spending breakdown within those sectors.
- Visualization Development:
a. Design an interactive pie chart representing the tax dollar allocation across various sectors (e.g., 100 to defense, etc.) based on the user’s input tax amount (e.g., $1000).
b. Implement a feature that allows users to click on a pie section to expand it, revealing a nested pie chart that further breaks down spending within that specific sector (e.g. clicking on the transportation sector shows how much was spent on highways, public transit, bike lanes, etc.).
- Engaging with Decision-Makers:
a. Research and identify government officials responsible for the allocation of tax revenues and the decision-making process for each sector (e.g., healthcare, defense, education, transportation, etc.).
b. Provide users with the contact information of relevant government officials, allowing them to directly engage with decision-makers regarding their concerns, suggestions, or questions about specific projects and spending allocations.
c. Encourage users to participate in public policy discussions and advocate for changes in spending priorities based on their understanding of the tax revenue allocation.
Examples
Example #1
Imagine you’re Maria, a Berlin resident curious about how your tax euros are allocated by the government, with a keen interest in funding for improving bike lanes and subsidies for church restorations. You enter your annual tax payment of €1000, and the tool generates an interactive pie chart displaying the allocation across sectors like healthcare, defense, education, and transportation. By clicking the transportation and cultural sectors, you find out that €50 of your taxes support bike lane improvements and €20 goes toward church restorations. Although you appreciate the historical significance of churches, you wonder if reallocating some funds could benefit other areas, such as bike lanes. The tool provides contact information for a city council member responsible for transportation and infrastructure, so you reach out to express your concerns and advocate for an increased budget allocation for bike lane improvements. This experience not only gives you a clearer understanding of your tax euros’ allocation but also empowers you to participate in public policy discussions and advocate for change in your community.
Example #2
Imagine you’re Alex, concerned about potential corruption involving local airport funds. You use an interactive visualization tool to investigate your tax dollar allocation. Upon entering your annual tax payment, the tool displays a pie chart with spending breakdowns. You find a significant portion allocated to the local airport’s budget, reinforcing your suspicion. Motivated, you gather like-minded individuals, and together you research the airport’s budget and contracts. Your group uncovers corruption involving a high-ranking official, and after sharing your findings with local media, increased transparency in government spending is achieved. The visualization tool not only provides clarity on tax spending but also inspires you to take action and make a difference in your community.
Detailed plan
Data collection
Research and identify the primary sources of government budget and expenditure data in Berlin, such as the Federal Ministry of Finance, the Berlin Senate Department for Finance, and other relevant agencies responsible for managing budgets in various sectors (e.g., healthcare, defense, education, transportation, etc.).
Minimum Viable Product
Collect data on the percentage of your taxes that go to each level of government (federal, state, and district).
In Berlin, there are three main levels of government to consider:
- Federal level (Bundesebene): This level represents the German federal government, which collects and distributes taxes for purposes such as defense, healthcare, education, and other nationwide projects.
- State level (Landesebene): This level represents the Berlin state government, which is responsible for managing the budget and finances for the state. It collects and allocates tax revenue for state-specific projects and services.
- District level (Bezirksebene): Berlin is divided into 12 districts or “Bezirke.” Each district has its own local government, which is responsible for managing local services such as waste management, public parks, and other community projects. They receive a portion of tax revenue from the state government.
After calculating the above (let’s assume out of 800 went to the Federal level) find a Finanzplan and see to which ministries tax money went.
- Social Security and Welfare: This includes programs such as unemployment benefits, pensions, and other social assistance initiatives aimed at supporting the well-being of the German population.
- Healthcare: The federal government contributes to healthcare funding, which includes the public health insurance system, medical research, and public health programs.
- Defense: Tax money is used to fund the German military, ensuring the nation’s security and defense capabilities.
- Education and Research: The federal government invests in education and research institutions, such as universities and research centers, as well as providing financial assistance for students.
- Infrastructure and Transportation: The federal government allocates funds for the development and maintenance of nationwide infrastructure projects, such as highways, railways, and airports.
- Public Debt and Interest Payments: A portion of tax money is used to service the public debt and pay interest on the debt incurred by the federal government.
- Public Safety and Security: This includes funding for law enforcement agencies, such as the Federal Police, and other organizations responsible for maintaining public safety and security.
- International Affairs and Development Aid: The federal government spends tax money on foreign diplomacy, international organizations, and development aid to support other countries in need.
- Environment and Energy: The federal government invests in programs and initiatives that promote environmental protection, climate change mitigation, and the development of renewable energy sources.